

Key Takeaways
-
Board risk reporting for cybersecurity is an evidence-and-cadence discipline that uses quantified, repeatable, and defensible packages supported by documented timelines of first detection.
-
A defensible report translates technical exposures into business and financial terms using the FAIR (Factor Analysis of Information Risk) model to produce loss ranges with explicit assumptions rather than point estimates.
-
A three-tier reporting cadence with a standing brief at every board meeting, a material-incident update within 24 hours of materiality determination, and a quarterly deep-dive supports timely and appropriate governance oversight.
-
An evidence trail that documents when each exposure was first observed, its source, entity attribution, severity assessment, and subsequent action turns a report into a defensible governance artifact.
-
Cyble supplies the external evidence layer through continuous monitoring across the surface, deep, and dark web with automated entity resolution and integration into 70+ enterprise platforms.
See what external monitoring uncovers in your environment
What Board Risk Reporting For Cybersecurity Delivers
Board risk reporting for cybersecurity translates technical exposure into business and financial terms on a defined cadence. It benchmarks performance against the risk appetite the board has approved and relies on a documented evidence trail that shows when each exposure was first detected, where the finding came from, and what action followed.
Most programs invest in the translation layer and convert patch counts into business language. Many treat the evidence layer as an afterthought. Regulators and auditors focus on that gap first. A time-stamped detection record is what turns a board report into a defensible governance artifact. Without it, the report remains a communication exercise.
Board Cybersecurity Reporting Cadence That Stands Up To Scrutiny
NACD’s 2026 cyber-risk oversight guidance describes a three-tier board reporting cadence. It includes a standing cyber-risk brief at every board meeting, a material-incident update within 24 hours of determining materiality, and a quarterly deep-dive session. Each tier serves a distinct governance function.
-
The standing brief. A short, recurring update at every board meeting, typically a two-page executive summary and dashboard, keeps the board’s baseline current and prevents surprises between formal reviews. Consistent metrics across cycles matter more than the specific metrics chosen. Trend analysis is the primary purpose of this tier.
-
The material-incident update. This update is triggered by a material event, not by the calendar. For public companies, this cadence aligns with the U.S. Securities and Exchange Commission (SEC) Form 8-K Item 1.05 rule, which requires disclosure of a material cybersecurity incident within four business days of the materiality determination. The clock starts at the materiality decision, not at discovery. The SEC also requires that the materiality determination be made without unreasonable delay after discovery, so a deliberately slow analysis creates a rule violation.
-
The quarterly deep-dive. This session provides a substantive review of exposure, risk posture, and performance against the board’s stated risk appetite. Quantified loss ranges, third-party exposure, and forward-looking assessments belong here. The NACD guidance positions this as a strategic workshop that covers emerging threats and budget alignment.
The material-incident update is the cadence most programs have not designed in advance. Its credibility depends on a time-stamped record of first detection. That record anchors the four-business-day clock and allows the board to demonstrate informed oversight to a regulator reviewing the disclosure timeline.
How To Quantify Cyber Risk For The Board
The translation layer often causes board reports to fail. A technical finding must travel from its raw form to a board-legible risk statement that names the affected business line, the potential consequence, and the response window. Two worked examples show how this translation works in practice.
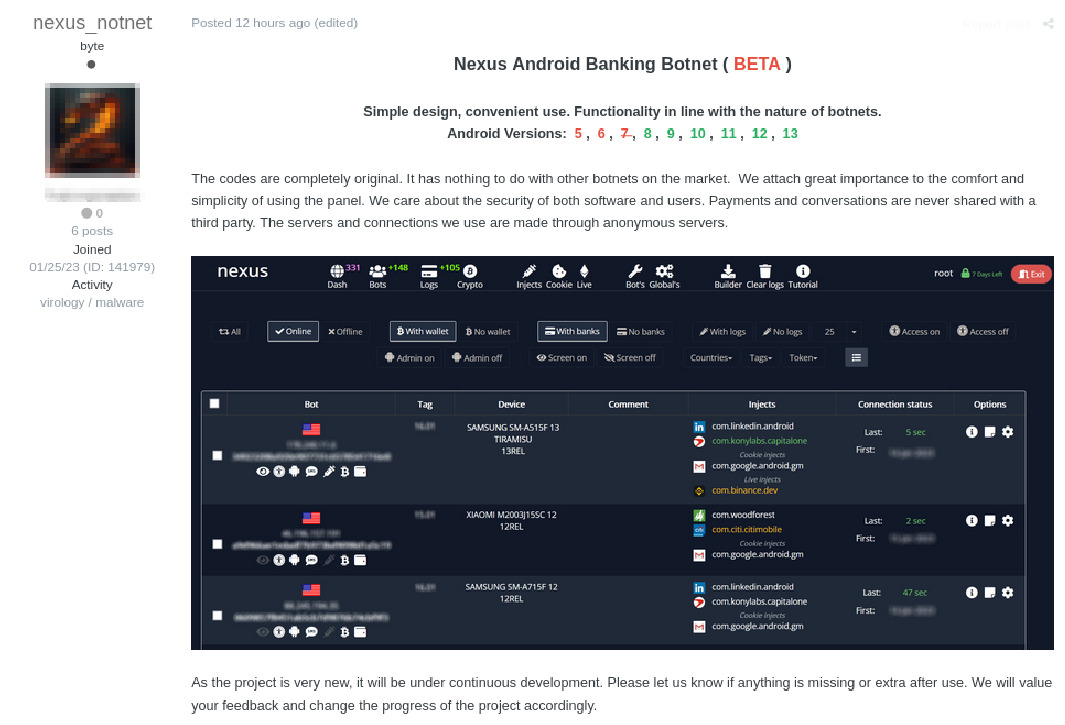
Example one: credential exposure on the external attack surface. Cyble’s continuous monitoring across the surface, deep, and dark web, with visibility into more than 15,000 darknet marketplaces, detects a credential dump containing employee accounts with access to the organization’s customer-facing payment portal. The raw finding is a set of usernames and hashed passwords on a criminal forum. The board-facing statement becomes: “Credentials associated with approximately [n] accounts in the retail payments business line were observed on a criminal marketplace on [date]. If exploited, the exposure path leads to unauthorized account access, potential fraud loss in the range of $X to $Y, and a notification obligation under [applicable regulation]. The detection-to-alert window was [n] hours. Containment action taken: [specific action].” The inputs such as credential exposure, affected population, fraud consequence, and response window are all named.
Example two: a third-party or supply chain finding. External monitoring identifies that a critical software vendor has suffered a breach affecting the application programming interface (API) keys used to connect to the organization’s order management system. The board-facing statement becomes: “A third-party service provider breach has exposed integration credentials used by our order management platform. The concentration risk is material: this vendor handles [n]% of order processing volume. Notification obligations under [applicable contract or regulation] are triggered. Estimated remediation window: [n] days. Alternative processing capacity: [status].” The finding turns into a board line item about concentration risk and notification obligations.
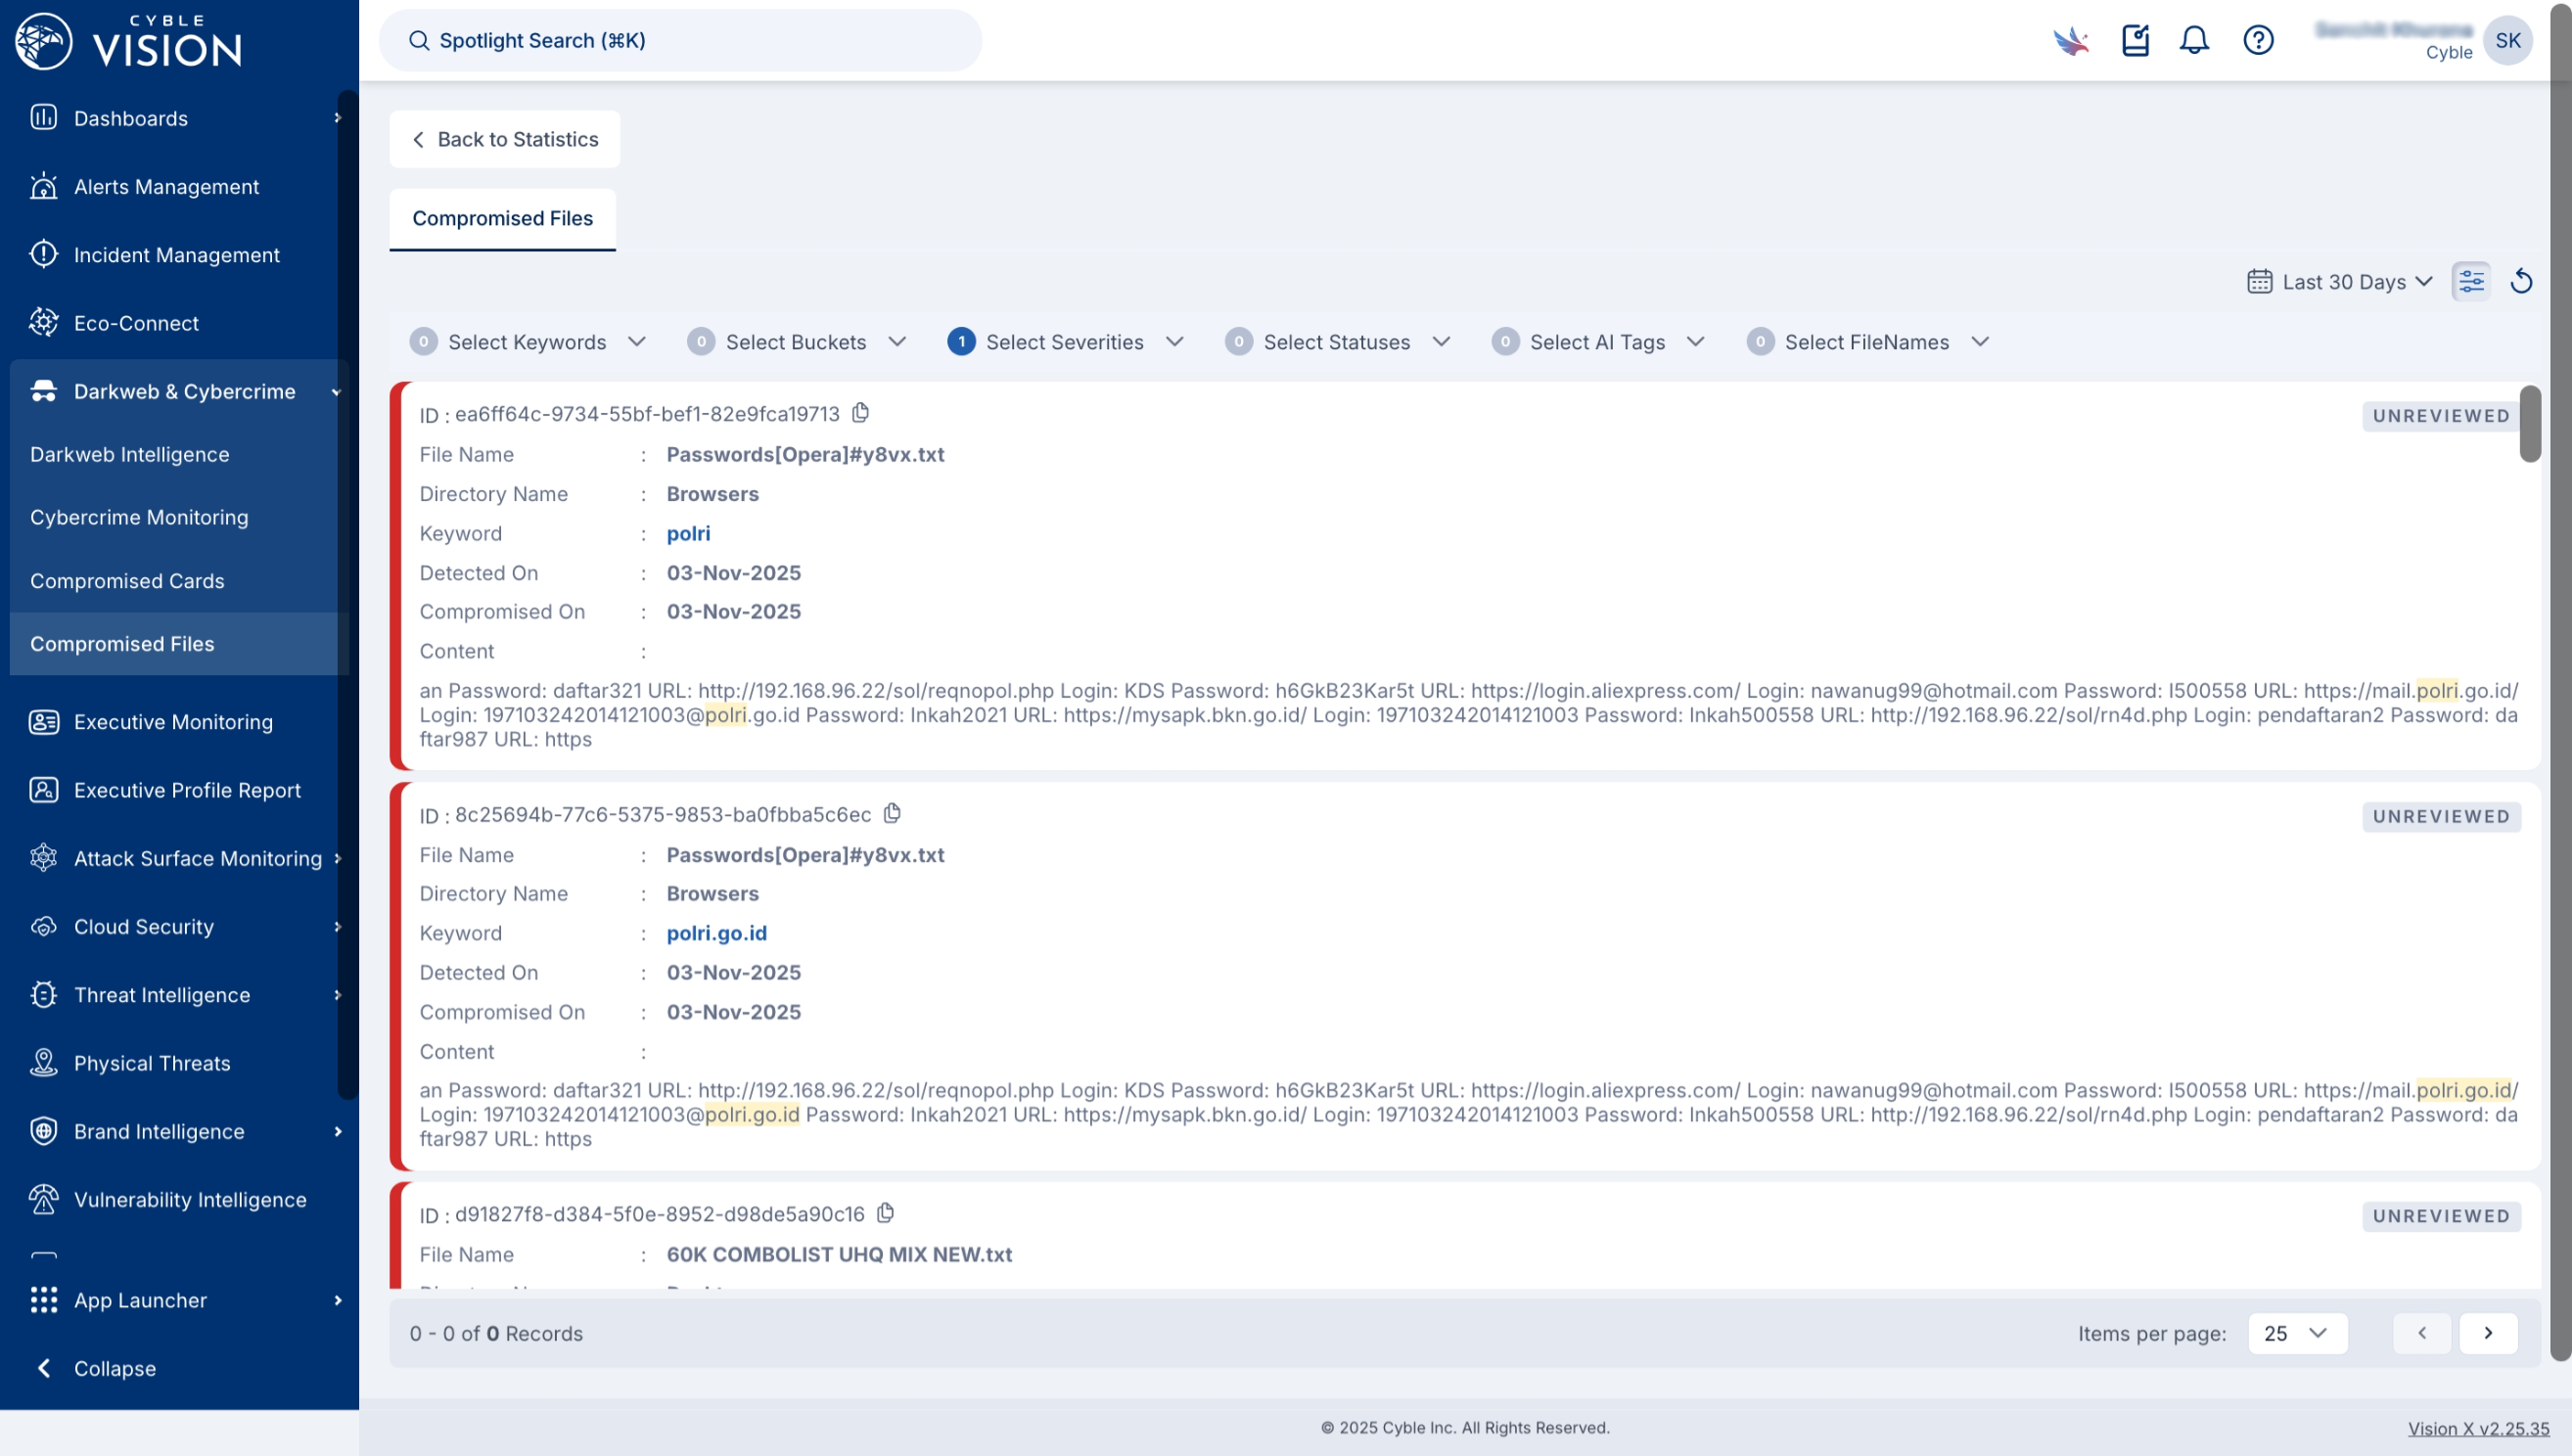
Both examples follow the same four-step translation path. First, identify the technical condition. Then connect it to a business asset or process. Next, estimate the consequence in financial or operational terms. Finally, state the decision or action required.
Turning Exposure Into A Dollar-Loss Range The Board Can Act On
A single point estimate such as “this risk will cost us $3 million” does not stand up well under scrutiny. It suggests false precision and invites a “how do you know” challenge that no one can answer. A range with explicit assumptions is more honest and more useful for governance decisions.
The FAIR (Factor Analysis of Information Risk) model, maintained by the FAIR Institute, decomposes risk into two top-level components. Loss Event Frequency estimates how often a loss event is likely to occur. Loss Magnitude estimates how much a single event would cost, combining direct costs such as response and recovery with secondary costs such as regulatory penalties and customer churn. A Monte Carlo simulation runs the model across thousands of scenarios to produce a loss distribution. The output includes an expected annual loss, a worst-case figure at a chosen confidence level, and the probability of exceeding any threshold the business cares about.
The board-facing output from a FAIR analysis is a scenario, a range, and the assumptions behind it. For example: “A ransomware event affecting our customer data platform carries an annualized loss exposure of $2.4M to $8.1M, with a 90th-percentile outcome of $14M, based on the following assumptions about threat frequency and control strength.” A chief financial officer (CFO) can weigh that statement against an insurance premium or a remediation budget.
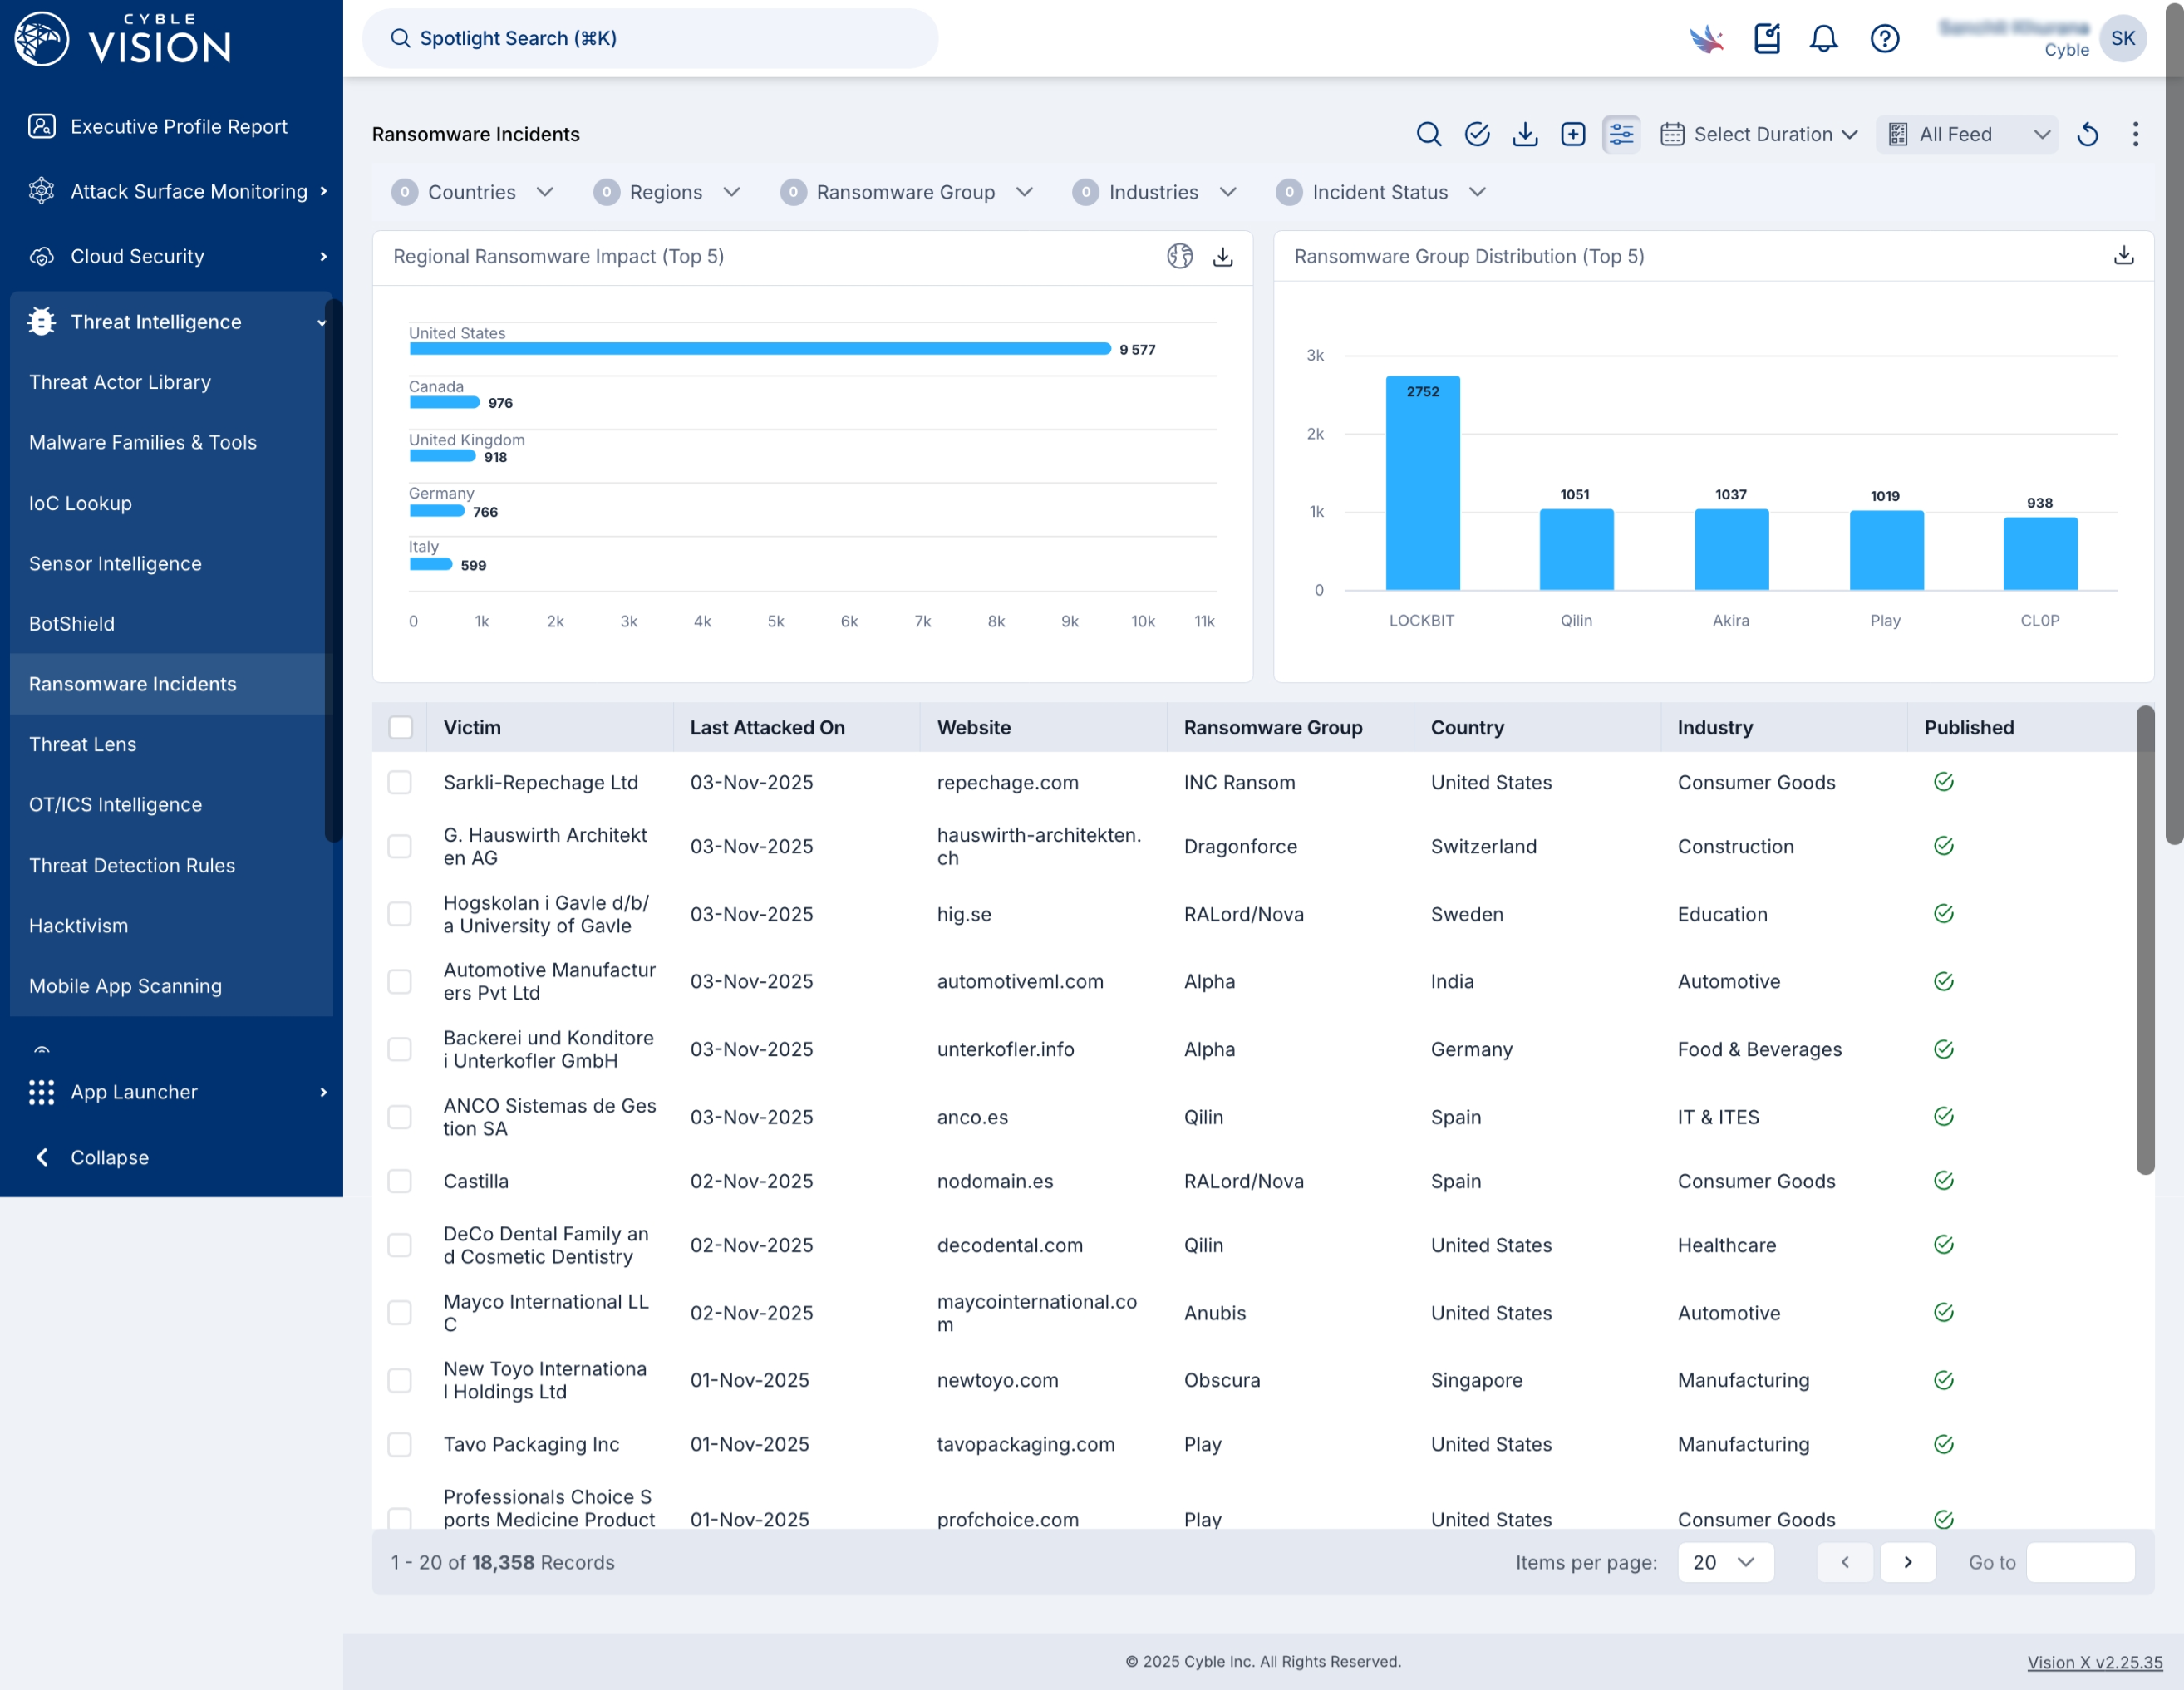
Cyble Vision applies the FAIR model to live telemetry and expresses exposure in financial terms. It ranks vulnerabilities by business impact and current threat activity rather than by Common Vulnerability Scoring System (CVSS) score alone. CVSS scores are technically useful but explicitly exclude monetary losses and business context. A CVSS 9.8 finding on a non-critical system may carry less financial exposure than a CVSS 6.0 finding on a system that processes payment transactions. Vision’s output gives the board the scenario, the range, and a prioritization order that reflects what attackers are actually doing against the organization’s specific environment. Results depend on the customer’s environment, asset scope, and configuration and should be validated against it.
Board Risk Appetite And Cyber Risk Tolerance In Practice
Risk appetite is the level of risk the board is willing to accept in pursuit of the organization’s objectives. Risk tolerance is the acceptable variation around that appetite, the operational boundaries within which management is authorized to act without escalating to the board.
This distinction shapes how reporting should look. Performance should be framed against the stated tolerance, not against raw counts. A board that has approved a risk appetite of no more than a 5% annual probability of a material data breach needs to see the current probability estimate against that threshold. The number of vulnerabilities remediated this quarter does not answer that question. When the current position exceeds the tolerance, the report should trigger a defined response such as management remediation within an agreed period, escalation to a risk committee, or a board decision where the exposure exceeds delegated authority.
Peer and sector context can support this framing without overstating precision. Stating that the organization’s annualized loss exposure sits above or below the sector median, based on available benchmarking data, gives directors a reference point for judging whether the risk is normal, elevated, or low relative to comparable organizations. The goal is directional credibility rather than decimal-point precision.
The Evidence Trail Behind A Defensible Board Report
The evidence trail turns a board report into a defensible record. The content of that trail follows directly from what a regulator or auditor asks for.
For each material finding that appears in the board pack, the record should capture:
-
The date and time the exposure was first observed, and the source of the finding
-
The entity the finding was resolved to, confirming that the exposure was correctly attributed to the organization before it was reported
-
The severity assessment against the organization’s own attack surface, not a generic industry rating
-
The action taken, by whom, and when
This record anchors the SEC’s four-business-day clock. A report that cannot produce that timeline fails to meet the SEC’s expectations and the examination standards of regulators such as the New York State Department of Financial Services (NYDFS), which issued guidance in September 2026 requiring covered entities to maintain thorough documentation of the entire risk assessment process, including the linkage between each risk and the controls that mitigate it, and any risk acceptance decisions.
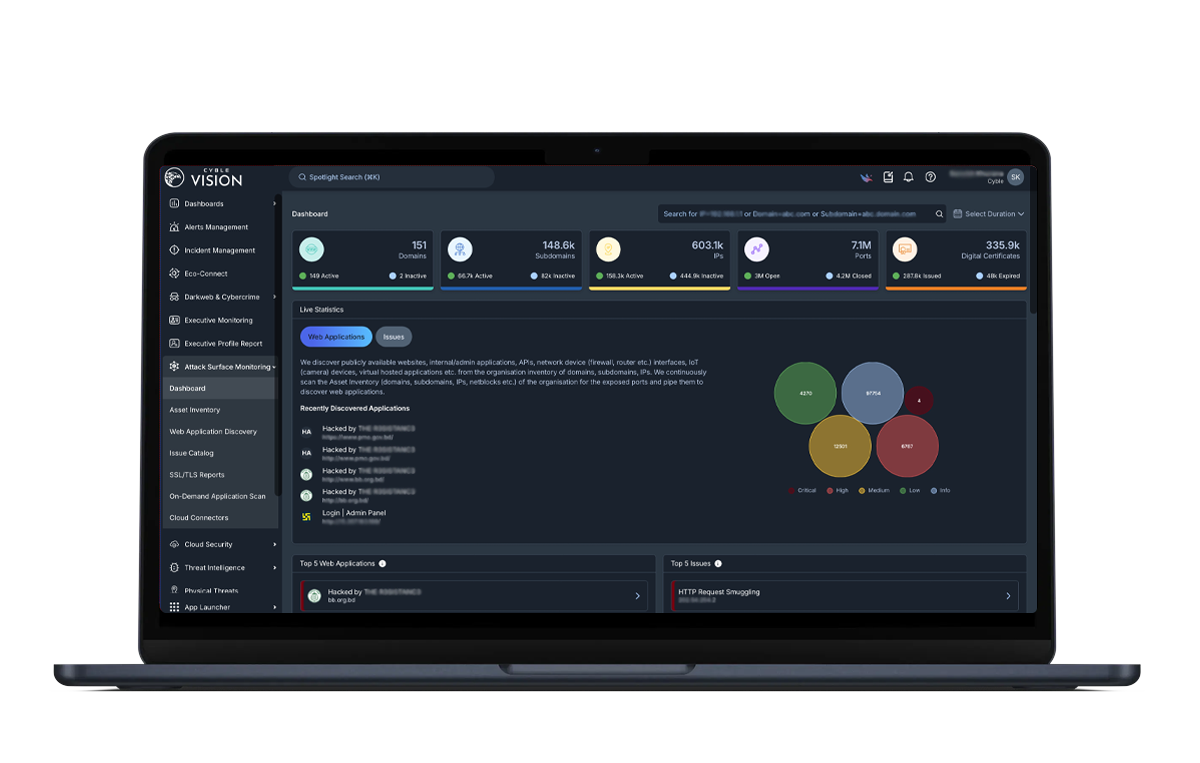
External detection provides a documented starting point for the notification clock that internal tools cannot supply. Cyble’s continuous monitoring across the surface, deep, and dark web creates a time-stamped record of first detection before the exposure reaches internal systems. Automated entity resolution attributes findings to the organization even across obfuscated spellings and multiple languages. That record forms the evidence layer behind the report. Cyble Vision integrates with 70+ enterprise platforms including Splunk, Microsoft Sentinel, IBM QRadar, Cortex XSOAR, and ServiceNow through native connectors, REST APIs, and TAXII support. Detection records then flow into the security information and event management (SIEM) and governance, risk and compliance (GRC) systems where audit trails are maintained.
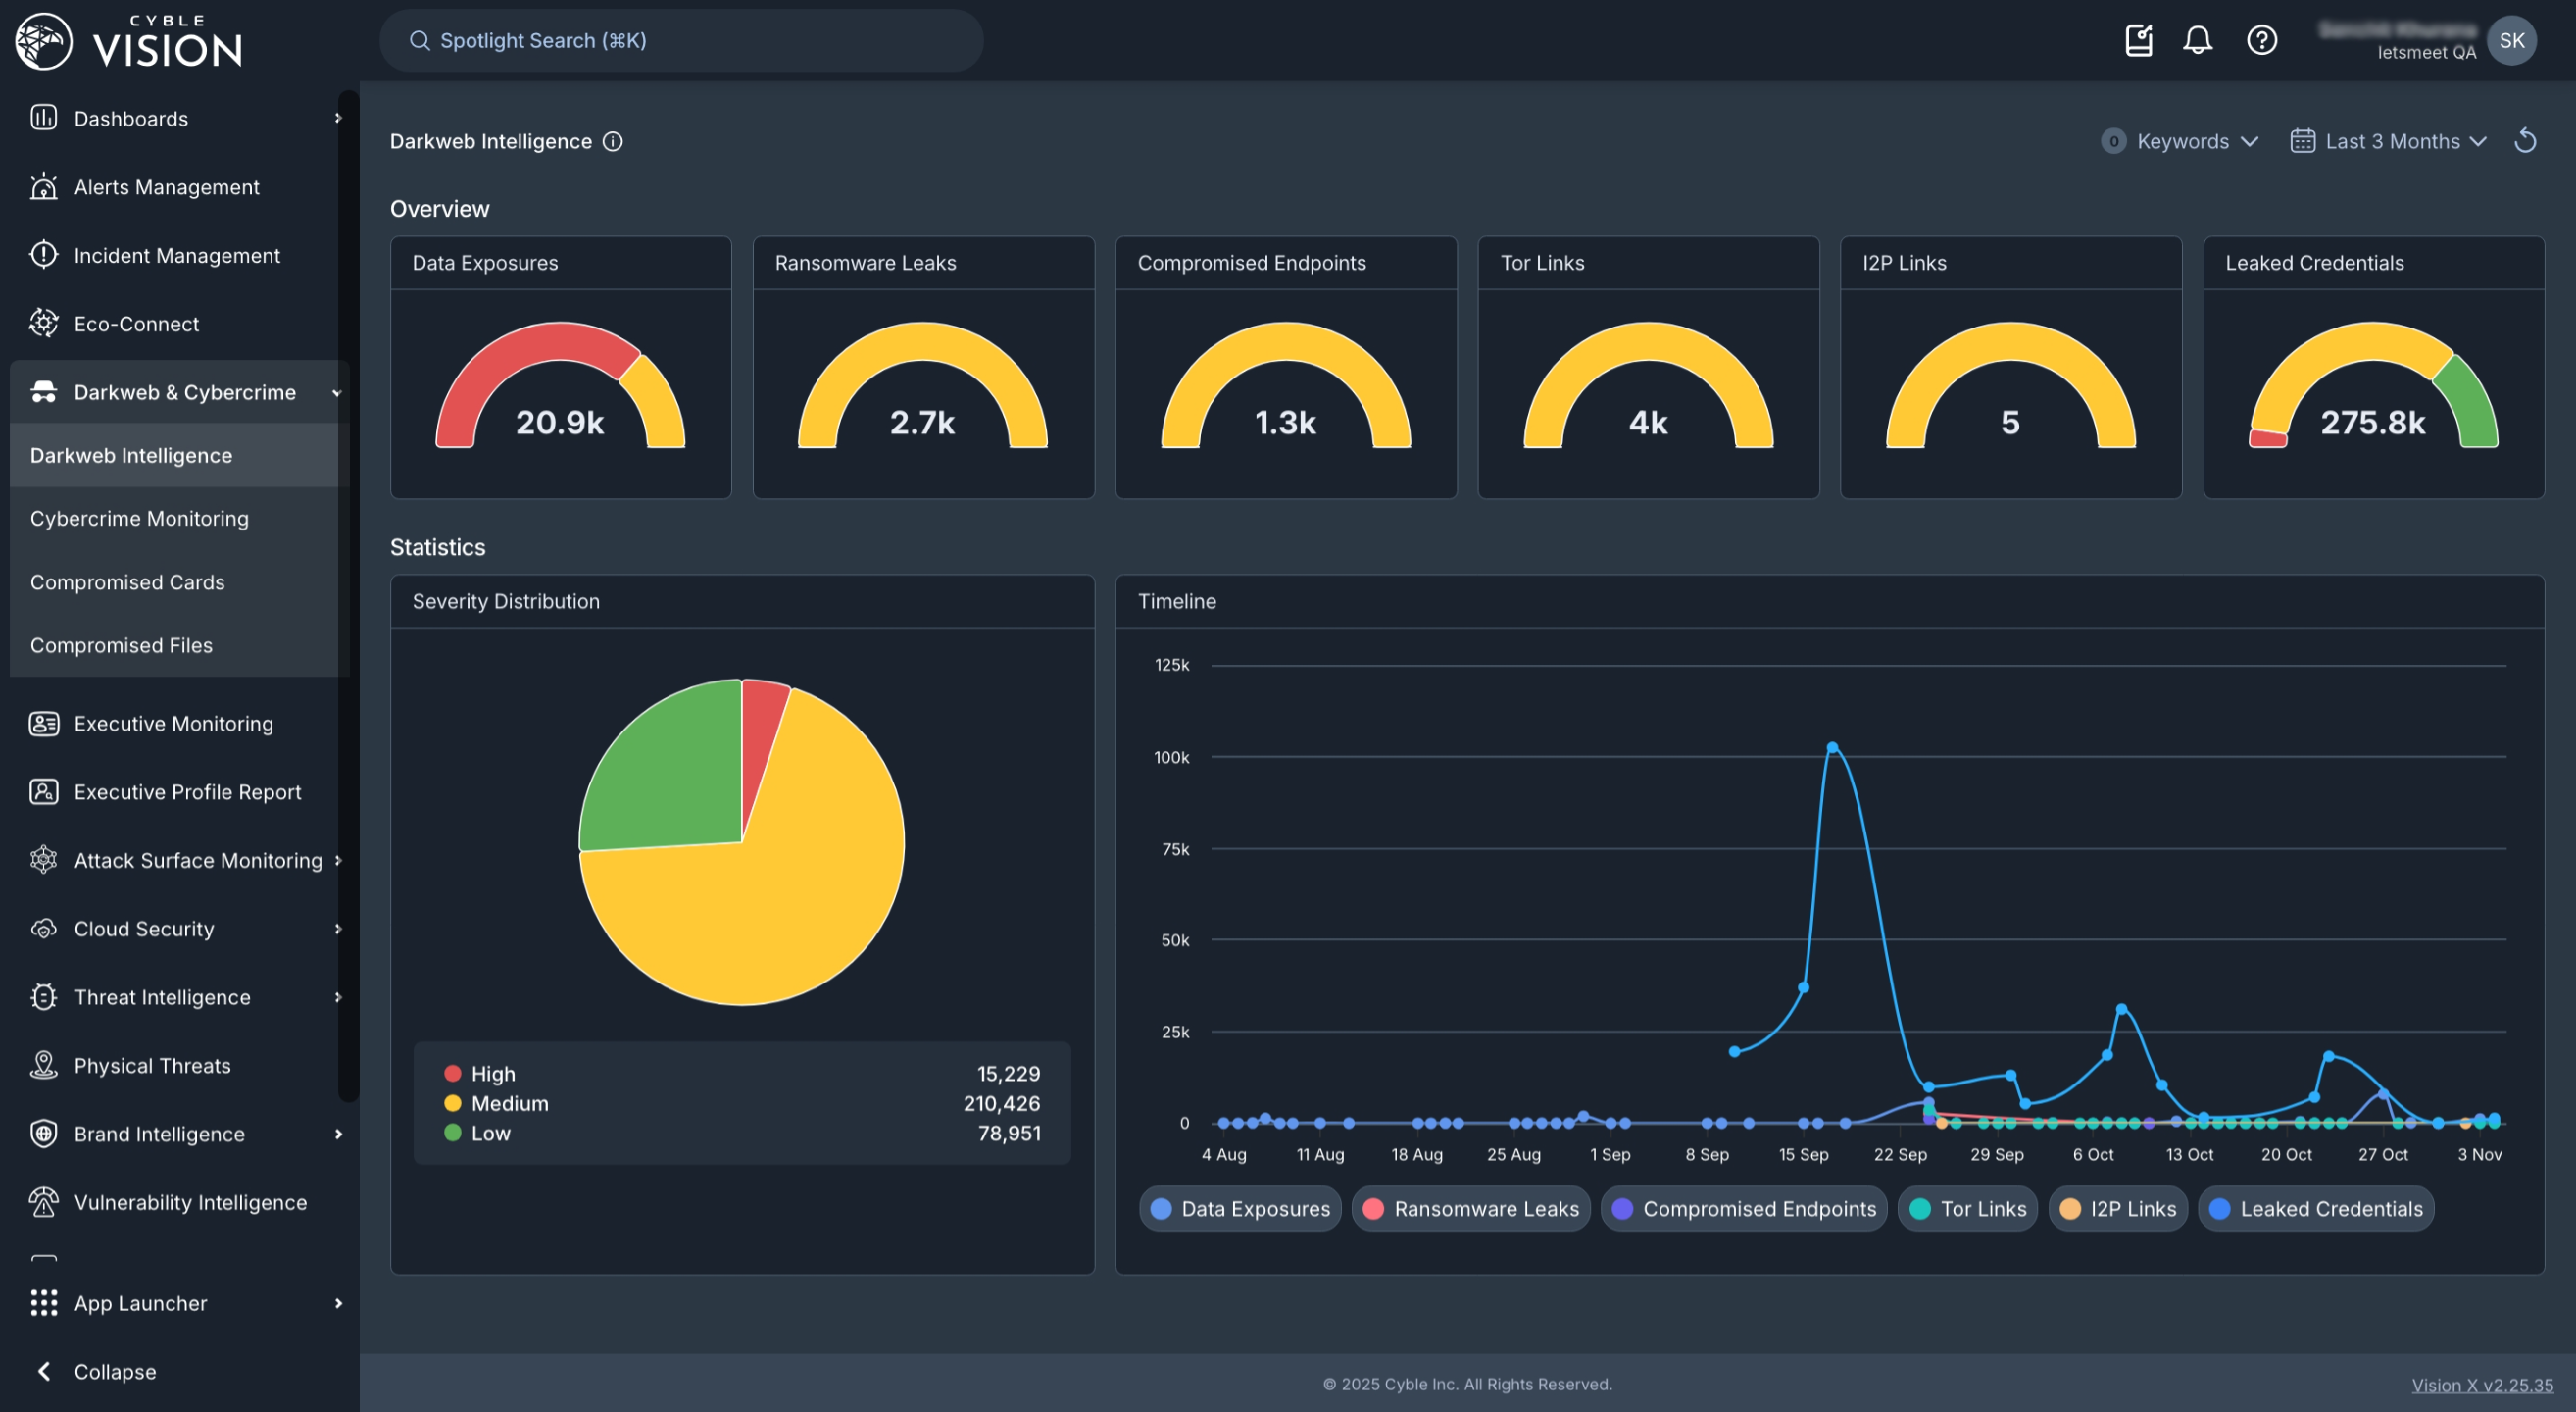
Build your time-stamped detection record with a Cyble demo
Cybersecurity Board Reporting Template And Example
With the evidence trail in place, the next step is structuring the quarterly deep-dive itself. A consistent section-by-section format turns the evidence into a repeatable governance routine. The following six-section structure maps to the governance questions boards actually ask.
-
Posture against appetite. Present the current risk position against the board’s stated risk appetite and tolerance thresholds. Source: FAIR-based quantification applied to live telemetry, benchmarked against approved thresholds. State whether the organization is within appetite, at the boundary, or outside it, and explain what that status means for escalation.
-
Material changes since last report. Summarize what changed in the threat environment, the asset inventory, or the control posture since the previous quarter. Source: external attack surface monitoring via ODIN, dark web monitoring via Cyble Vision, and internal change records. Include any new third-party integrations or acquisitions that altered the attack surface.
-
Quantified exposure with loss ranges. Highlight the top three to five scenarios ranked by annualized loss expectancy, each with a range and the assumptions behind it. Source: Cyble Vision applying the FAIR model to live telemetry. Present modeled figures as probability-weighted estimates under stated assumptions, not as precise measurements.
-
Third-party and supply chain exposure. Provide a named line item covering the highest-risk vendor relationships, estimated financial impact of a significant third-party breach, and concentration risk such as critical dependencies on single vendors. Source: external monitoring of third-party infrastructure and dark web mentions of vendor compromise. The NACD 2026 handbook identifies four specific third-party data points boards should request: which vendors carry the highest cyber risk, the estimated financial impact of a significant third-party breach, whether vendor mitigation requirements are measurably reducing risk, and third-party risk concentration.
-
Incidents and near-misses with time-to-detect and time-to-respond. Provide a plain-English summary of each incident at or above the defined severity threshold, including what happened, the business impact, containment status, and whether regulatory filing obligations were triggered. Source: incident response records and the time-stamped detection log. Include near-misses, as CISA recommends that boards be briefed on near-misses as well as confirmed incidents.
-
Forward-looking assessment. Describe emerging threats relevant to the organization’s sector, changes in the regulatory environment, and planned control investments with their expected effect on the loss range. Source: Cyble threat intelligence, including threat forecasting informed by dark web chatter and reconnaissance patterns, and external regulatory monitoring.
Common Pitfalls That Undermine Board Reports
Reporting activity instead of outcomes. Patch counts, blocked alerts, and phishing simulation completion rates describe what the team did, not whether the organization is safer. Replace activity counts with outcome metrics such as time-to-detect, time-to-respond, and movement in the annualized loss exposure figure. A related pitfall is presenting raw alert counts as risk. Alert volume often spikes when scanning improves rather than when risk worsens.
Presenting raw alert counts as risk. A high alert count paired with a low false-positive rate and fast containment reflects a stronger posture than a low alert count with slow response. Focus the report on the outcome and the residual risk, not the volume of alerts.
Delivering a point estimate with no assumptions. A single dollar figure without a range and stated assumptions cannot be defended under scrutiny. Use the FAIR model to produce a range and state the assumptions explicitly so the board can evaluate them.
Treating the report as a one-off deck rather than a cadence. A board that receives a different set of metrics each quarter cannot track trends. Establish a stable dashboard of four to six metrics measured the same way each quarter. Change the metric set only when the governance question it answers has changed.
Having no documented record of first detection. Regulators focus on this failure quickly. If the report cannot answer when an exposure was first observed, where the finding came from, and what action followed, it does not qualify as a defensible governance artifact. Build the evidence trail before the board meeting and keep it current.
Conclusion: Turn Cybersecurity Reporting Into A Defensible Governance Routine
A defensible board risk report for cybersecurity rests on three disciplines working together. The three-tier cadence of standing brief, material-incident update, and quarterly deep-dive ensures the board receives the right information at the right time and that the material-incident update is designed before it is needed. The translation layer converts technical findings into business-legible risk statements with financial ranges, using the FAIR model to produce defensible loss estimates rather than point guesses. The evidence trail documents when each exposure was first detected, where the finding came from, and what action followed, creating a governance artifact rather than a slide deck.
Three practical next steps: (1) confirm the board’s stated risk appetite in writing so performance can be measured against it; (2) design the material-incident update process now, including the escalation path and the disclosure decision tree; and (3) establish the time-stamped detection record by connecting external monitoring to the systems where audit trails are maintained.
Cyble supplies the external evidence layer that makes each of these disciplines work in practice. Its capabilities include continuous monitoring across the surface, deep, and dark web, automated entity resolution that correctly attributes findings to the organization, and relevance scoring against the organization’s own attack surface. Cyble Vision integrates with 70+ enterprise platforms including Splunk, Microsoft Sentinel, IBM QRadar, Cortex XSOAR, and ServiceNow, with native connectors, REST APIs, and TAXII support, so detection records flow into the governance systems where board reports are built. Capabilities, coverage, and service levels vary by subscription tier and region. Statistics cited from Cyble are drawn from Cyble internal telemetry. Threat actor attribution is expressed with confidence levels, not asserted as certainty.
Request a demo to see Cyble Vision in action